Spectro-what now?
You would be forgiven for thinking that Spectrogram is the social media platform of choice for Bond villains and Marvel universe baddies of ill repute.
It’s not. Quite the opposite in fact. A spectrogram is a powerful tool that can be used for analytical, practical and creative pursuits in the world of audio. If you’re not using spectrograms in your production or post-production workflow yet, read on.
We'll be looking at what they are, how to understand spectrograms, and practical and creative uses for them. It may just blow your mind.
Sound In Two Dimensions: What Is A Waveform
In this brave new digital age we live in everyone's familiar with audio waveforms; the wibbly line that represents recorded audio expressed in terms of time and amplitude (loudness). If you've been living in a cave for the past sixty years, congratulations, and here's a picture of an audio waveform:
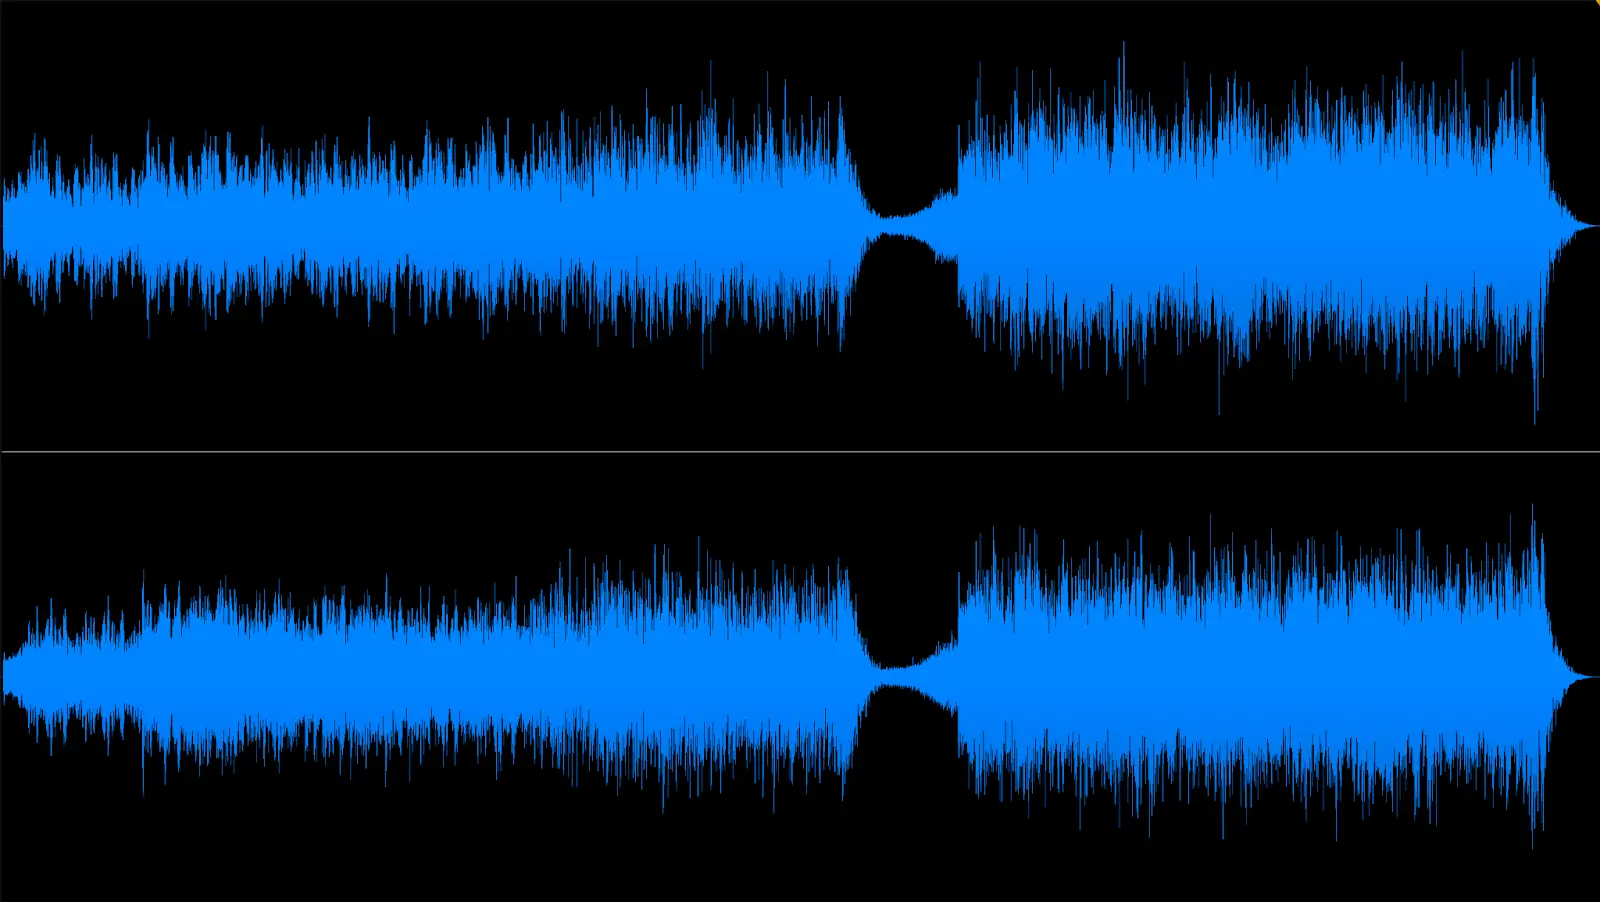
In an audio waveform, time is represented along the horizontal axis (often called the x-axis), and the wave amplitude, or loudness, is measured along the y- (or vertical) axis. It's essentially a type of graph for audio or sound.
Using this information it's possible to 'read' the waveform to a certain extent, without having to listen to the recording. In the above example you can see that the signal grows gradually louder over time, with an editor-friendly break down in the middle. Neat, huh?
This is handy for audio editing tasks and general production duties. It's easy to see where there's a break between signals to make a clean cut, or to see if a recording has a large dynamic range that'll need some taming with a compressor.
But with a waveform, you're not getting the full picture.
Enter the spectrogram.
Sound In Three Dimensions: What Is A Spectrogram
A waveform is a visual representation of audio in only two dimensions. With spectrograms you get a third dimension. Namely the frequency content of the audio.
This is huge. With this additional source of information you can read so much more about the audio file before you've even listened to it.
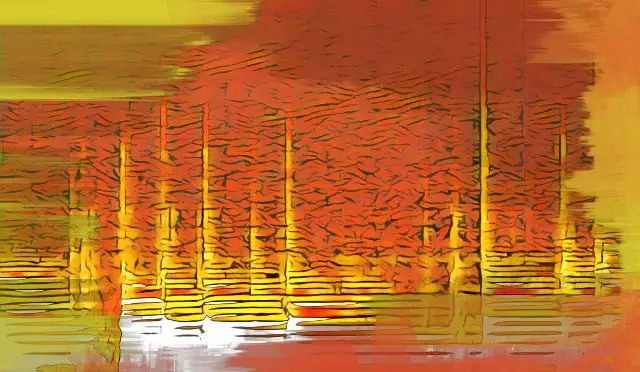
See what I mean? No?
Don't worry. Spectrograms can be a bewildering look at if you don't know how they work (more on this below). If you think the above picture is hard to decipher, consider this; spectrograms were originally generated on paper as black and white diagrams.
Things have moved on since then, and nowadays it's pretty easy to learn how to read a spectrogram. Let's take a look at how to 'see' sound.
Spectrogram Analysis: How To Read A Spectrogram
As on a waveform, on a spectrogram time marches along the x axis. What's different on is that the other axis represents the frequency spectrum, with low frequencies at the bottom, stretching to the top realm of human hearing.
Along the y axis you'll see all the individual frequencies that make up a sound; the fundamental frequency, or root frequency, that gives the sound its perceived pitch, and the harmonics that make up its unique color and tone.
How loud a particular sound is defined by a 'heat map' of the signal. This can be represented by color or intensity, depending on the spectrogram software you're using. But essentially the louder a sound is, the brighter it glows. Guitarists love that.
Examples Of Spectrograms
It's all well and good talking about this, but to make things easier to understand let's take a gander at some common instruments, and what they look like in visual representation form.
In all the below examples I'm using iZotope's RX editor to view spectrograms. In RX, the brighter an image is, the greater amplitude a note has.
Acoustic Bass
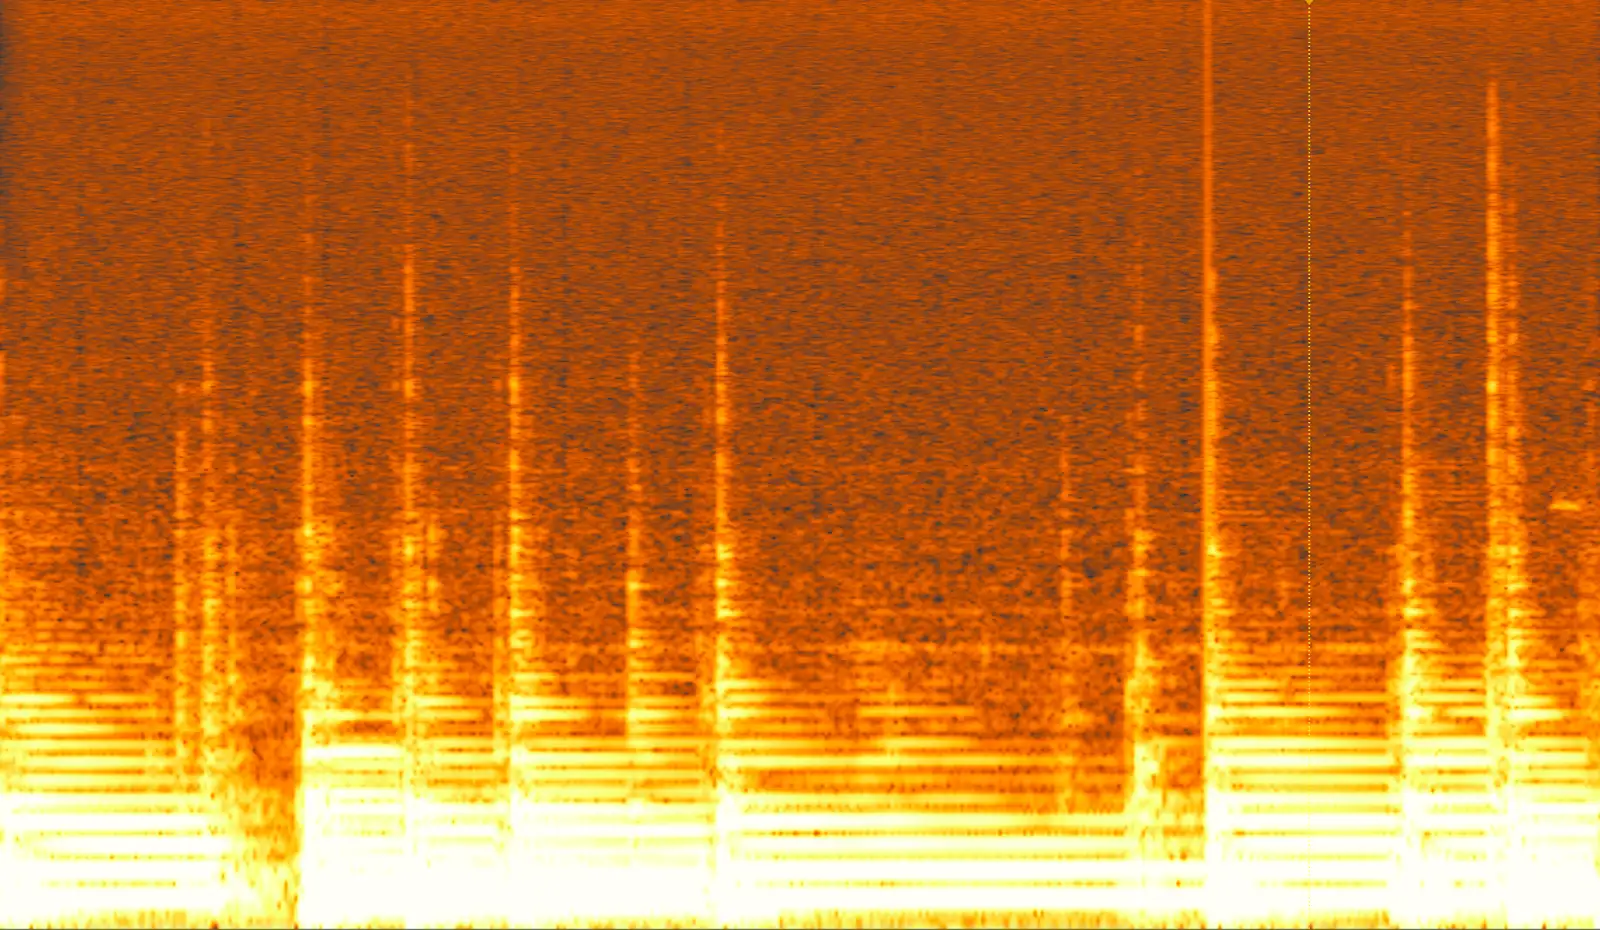
In this (admittedly noisy) sample of an acoustic bass lick you can see the powerful low frequencies as the brightest part of the image. towards the bottom of the graph.
The vertical lines are the sound of the strings being plucked. They're transitory, and contain more harmonic content than the actual sustained notes.
Saxophone
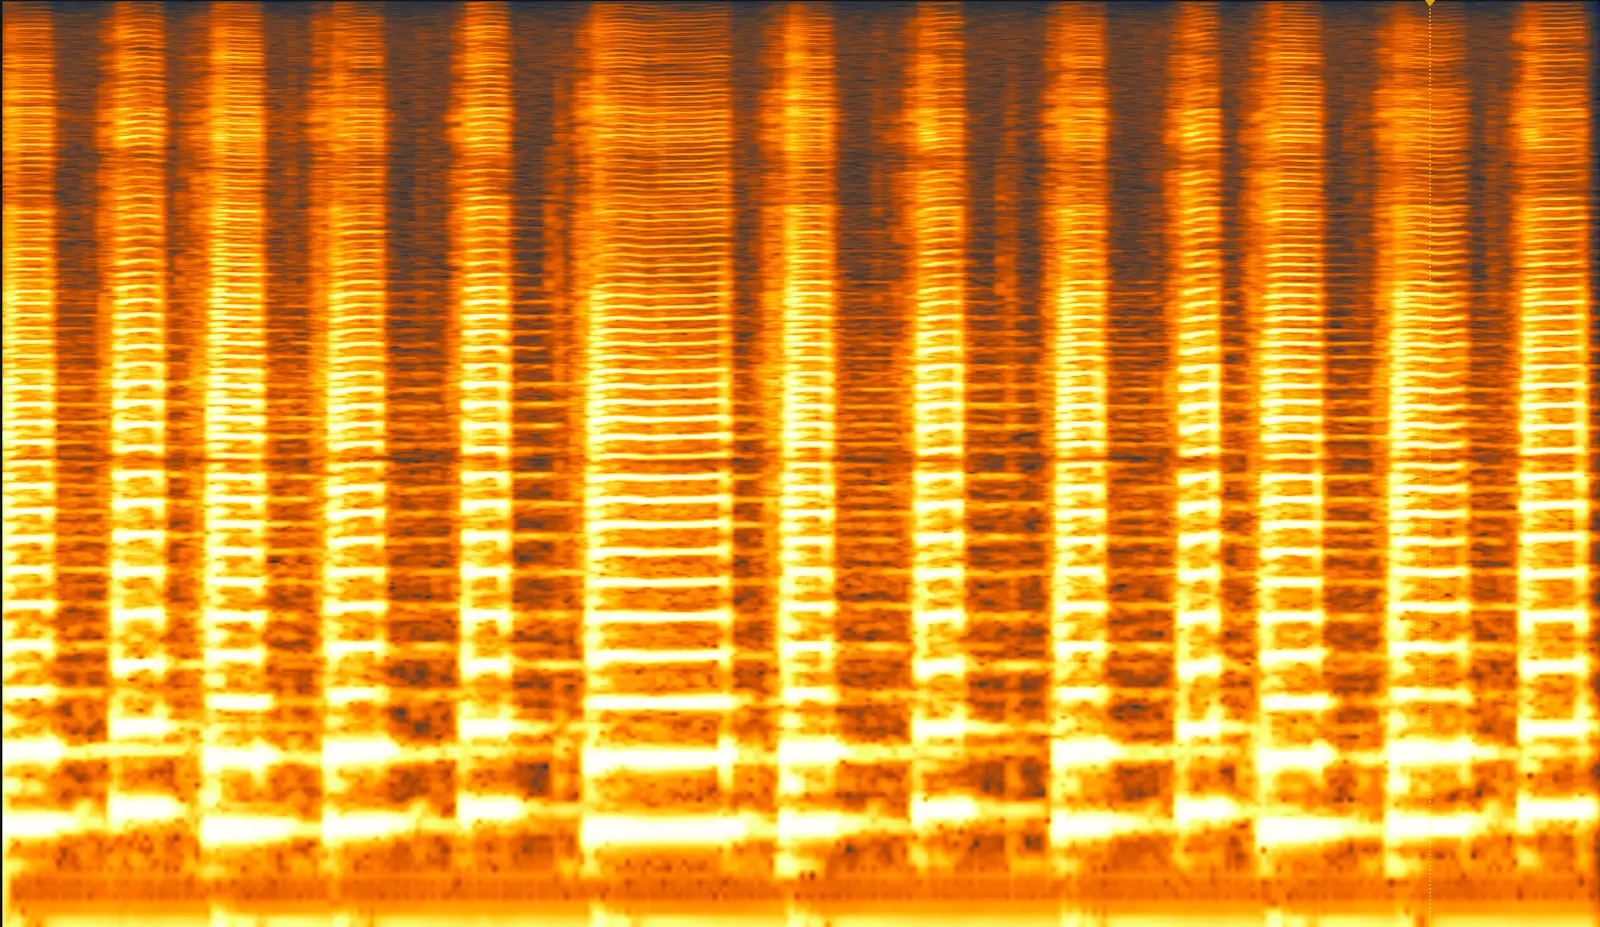
The saxophone is a harmonically rich instrument. In this example you can see the lowest frequency as the largest, brightest lines around 300-400hz, with all the the harmonics stacked up on top like a delicious heap of pancakes. You can see that a saxophone takes up room over the entire frequency spectrum.
Speech
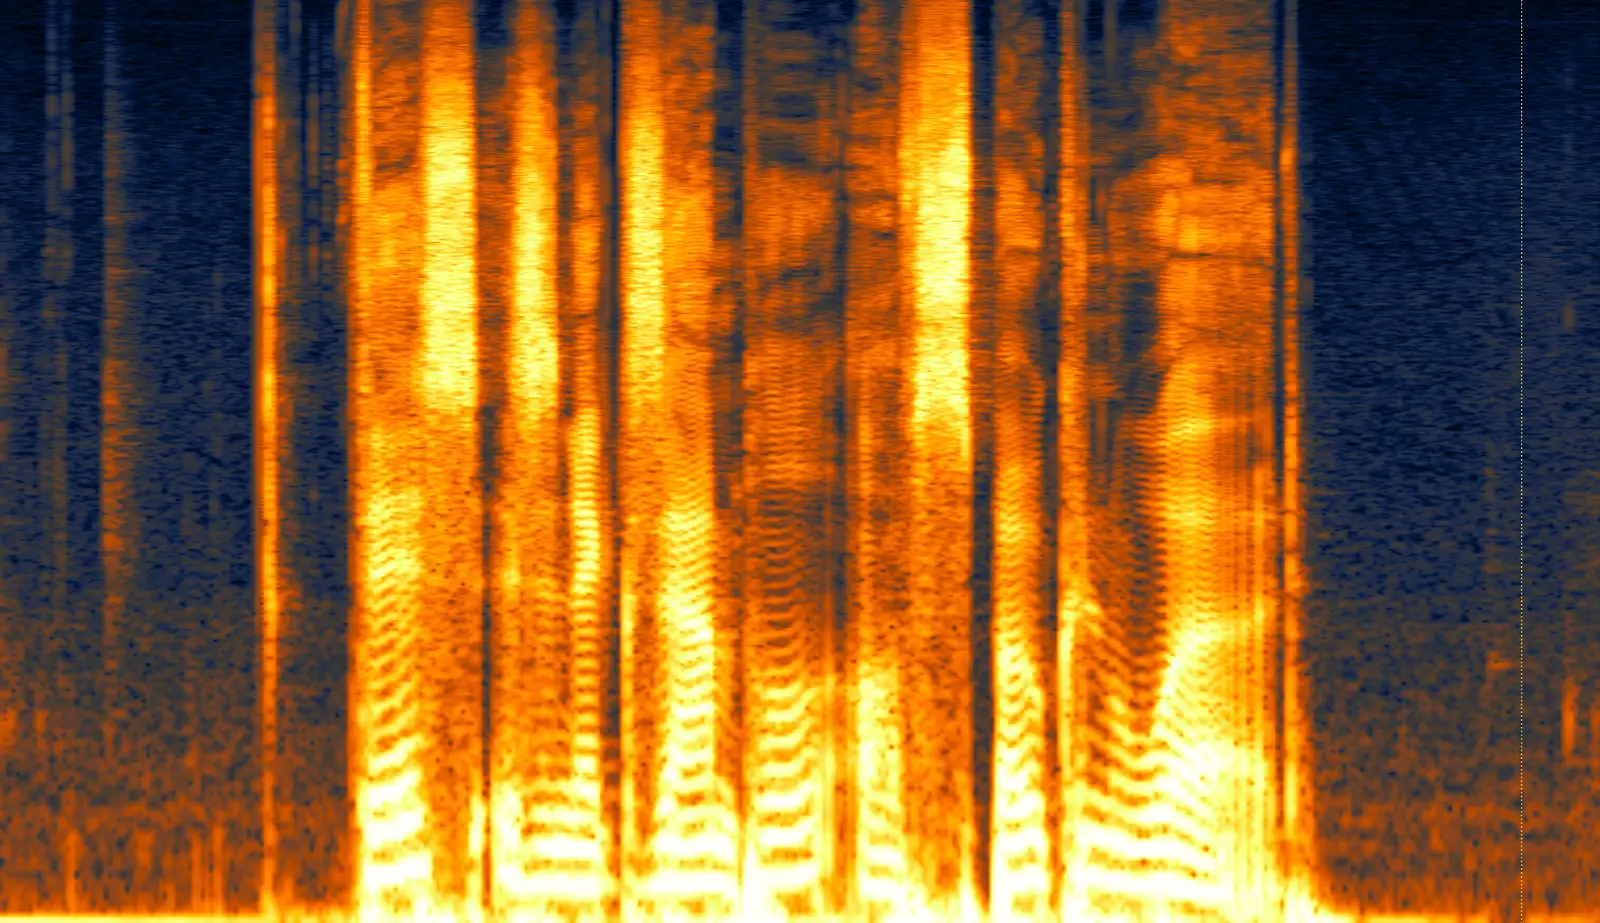
Spoken words have less overtones (or pancakes if you prefer), but a spectrogram still can tell you a lot about the audio. Different vowels and consonants will show up as different frequencies. With enough practice, it's actually possible to make an educated guess as to what is being said based on a spectrogram alone.
If you want to give it a try, in this example, I'm saying 'This is an example of spoken word'.
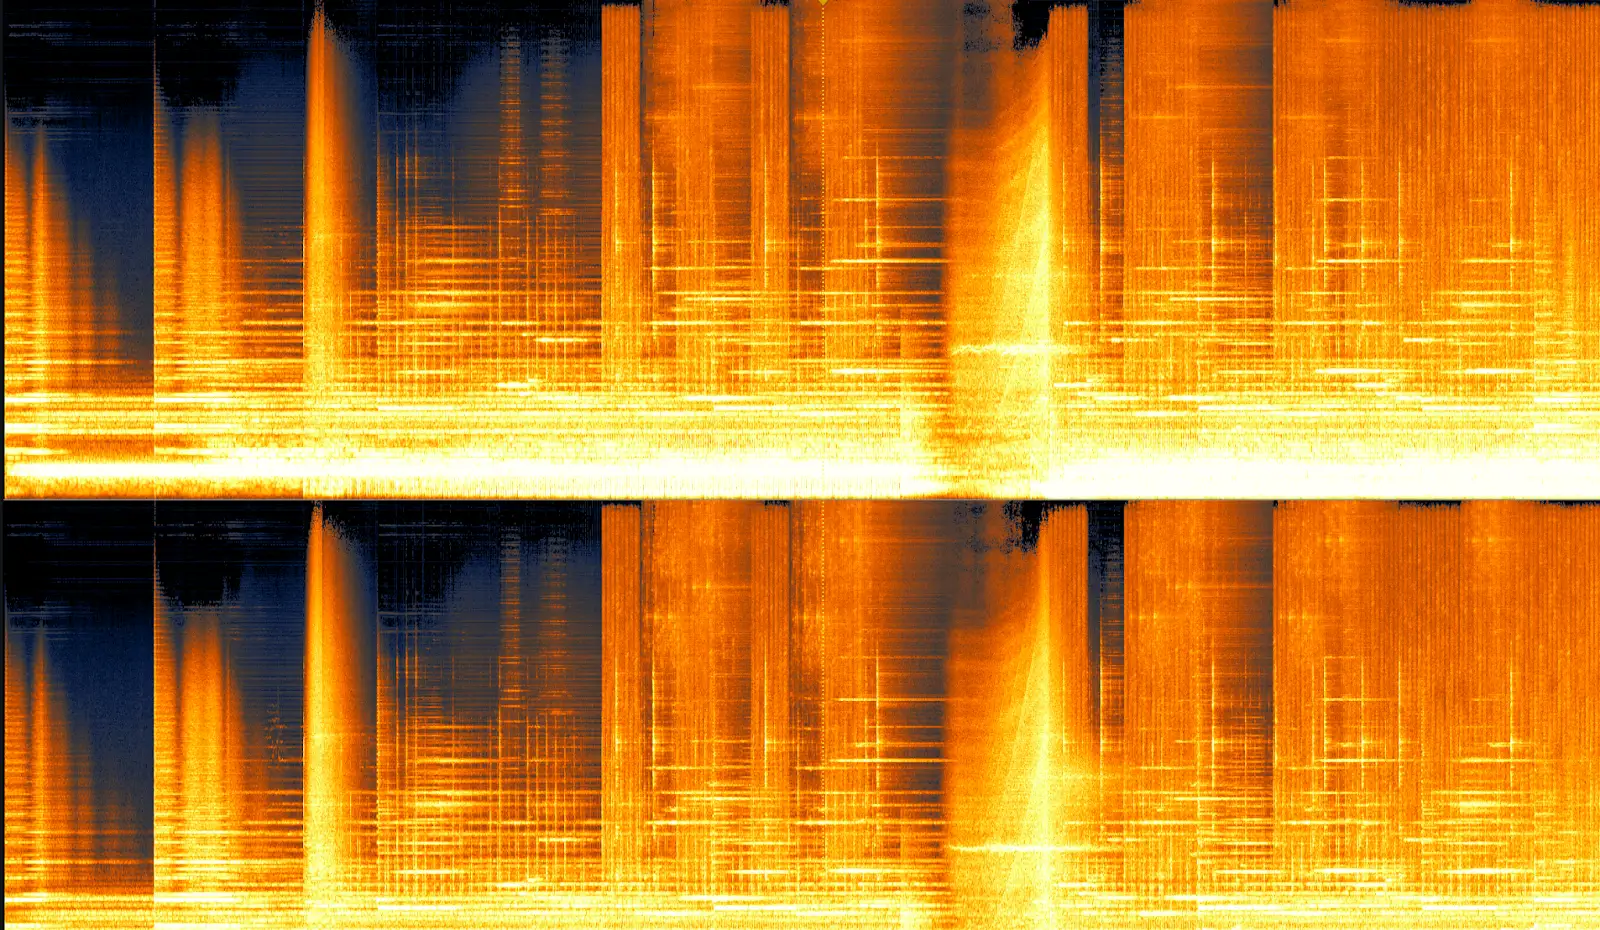
Vinyl Recording
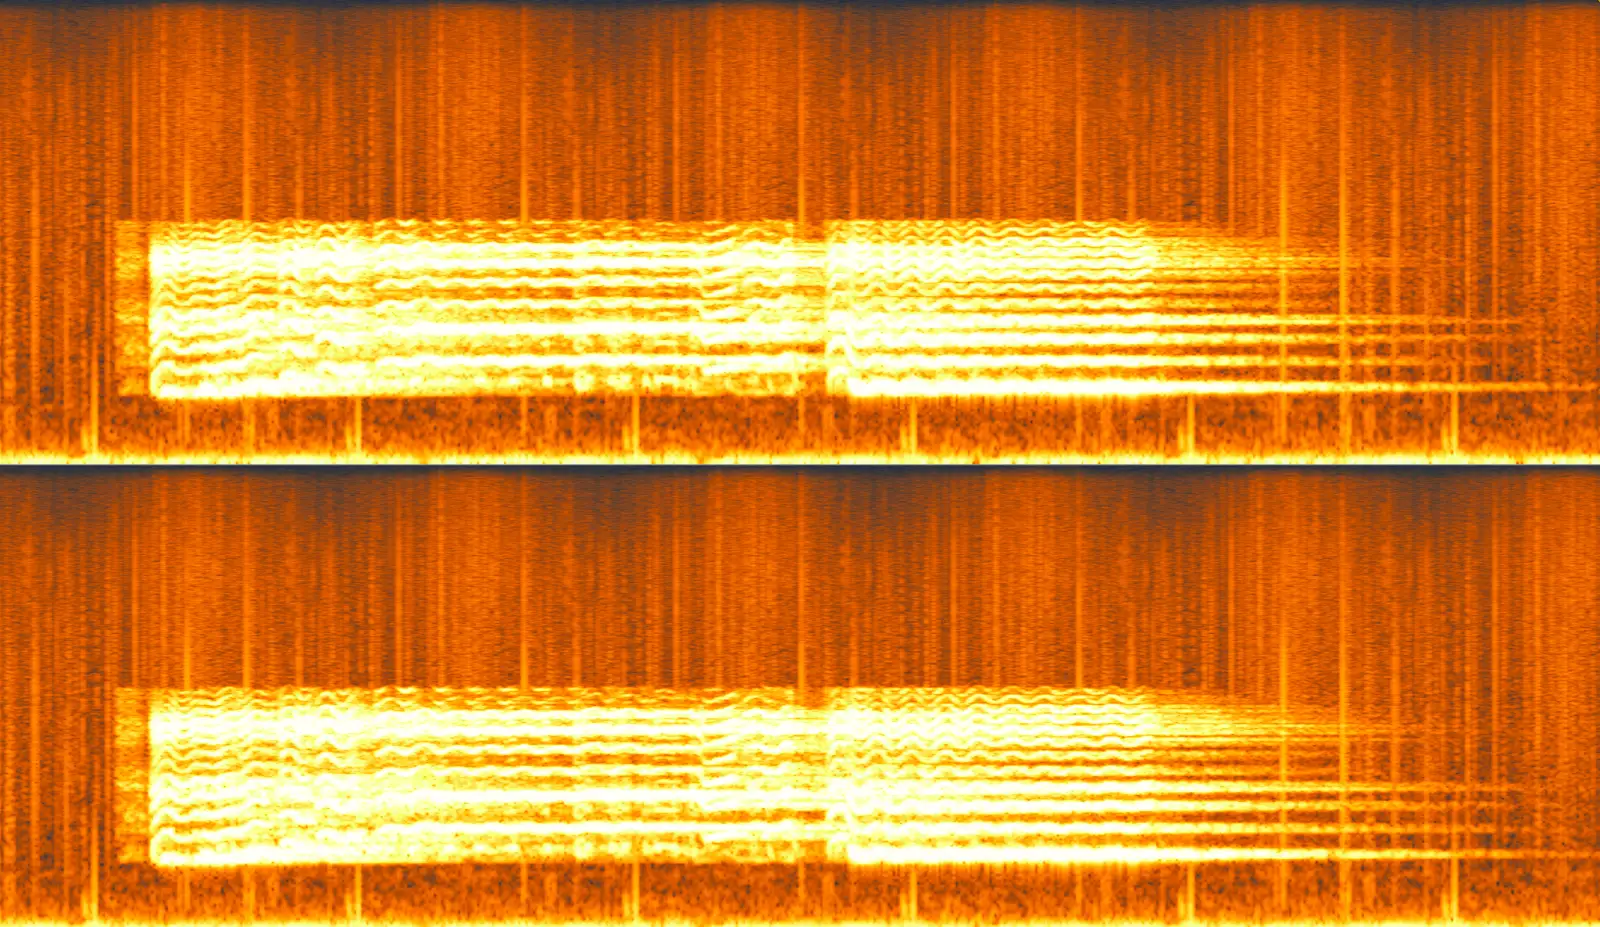
Here I've used a sample of a beautiful tenor singing on a crackly old recording. On this spectrogram it's easy to see the amplitude of the singing as brighter against the crackly background noise of the recording. Notice how singing has more harmonic content than speech.
Percussion
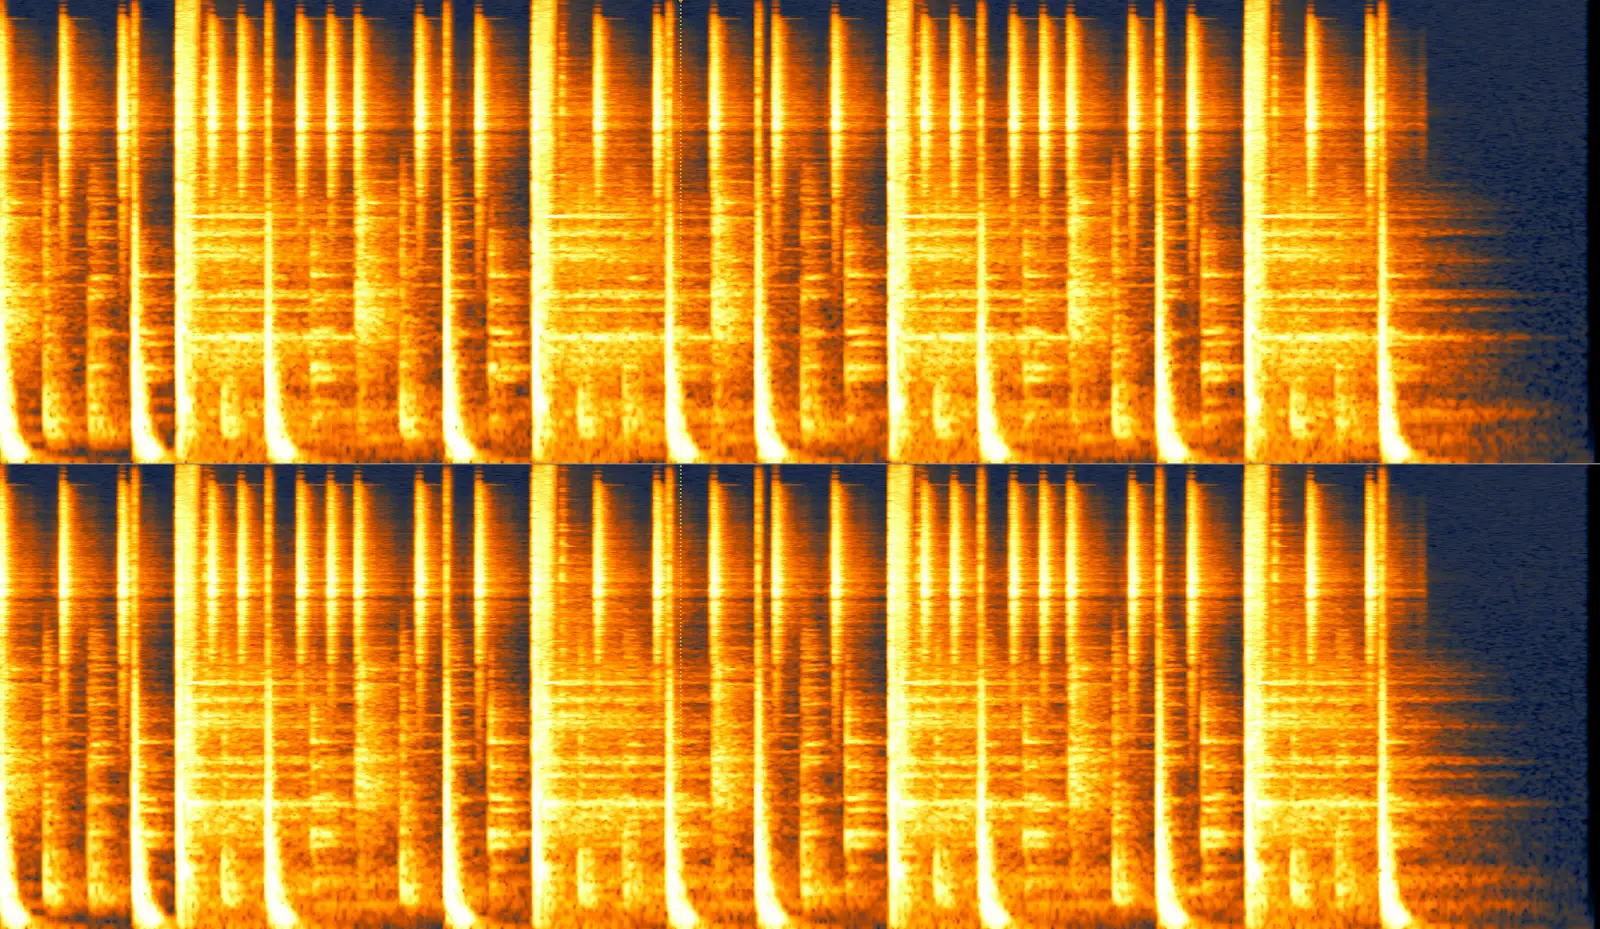
Finally let's take a look at percussion. Percussive instruments don't rely on a particular frequency as an identifying factor. Instead they occupy a large portion of the frequency spectrum.
The above example is a loop of a full kit playing. You can clearly see the biggest transient hits as bright peaks along the whole of the y axis. The kick drum (with the lowest frequency) shows as bright splotches along the bottom of the graph, while the hi-hats show as bright vertical lines towards the top. The strongest frequency here is 10kHz.
You can also see the longer tail of the hits on 2 and 4. These show as a transient, with a decaying signal over time.
If you're feeling fruity try to figure out what this beat sounds like IRL ;)
How To View A Spectrogram: Best Audio Software For Working With Spectrograms
To view audio as a spectrogram you'll need dedicated software. Bear in mind that you'll need to work with an entire audio file. This can be a tiny snippet of a longer recording, or a whole mix. You're not able to view a spectrogram of a recording being made.
Kapish? Here's the best audio software for working with spectrograms.
iZotope RX
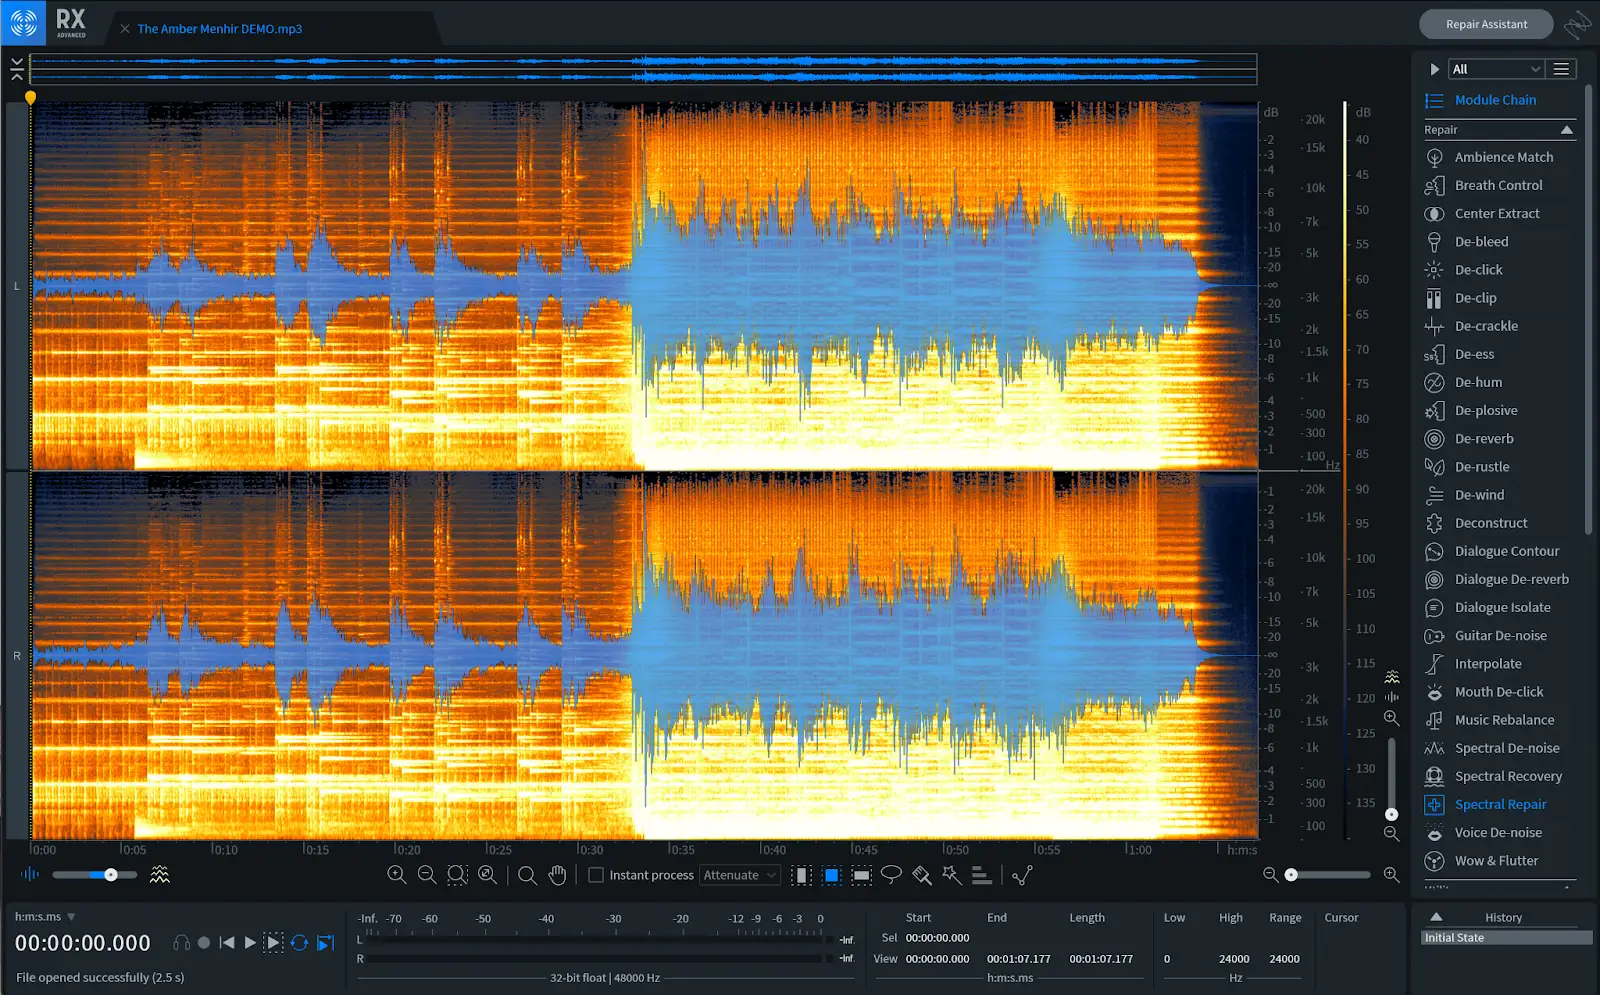
This popular software is an industry standard in sound design and post-production, due to the clever tools at your disposal for cleaning up even the most problematic audio.
While there's lots you can do with this, the most useful tool I've found for working in post is the Spectral Repair tool. This allows you to be hyper-specific in isolating problem frequencies and cleaning them up.
Adobe Audition
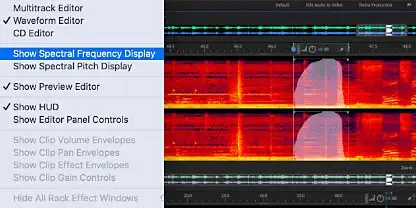
Another popular tool in the world of post-production, Adobe Audition includes a spectral editing tool, and various noise reduction tools as part of the package. It's a great option if you collaborate with other Adobe users on projects.
Steinberg Wavelab
Another behemoth in audio editing, Wavelab features a spectrogram view, with tools to edit specific frequency ranges. This feature is included in the slightly less costly Wavelab Elements. Good news for the budget-conscious. Speaking of which...
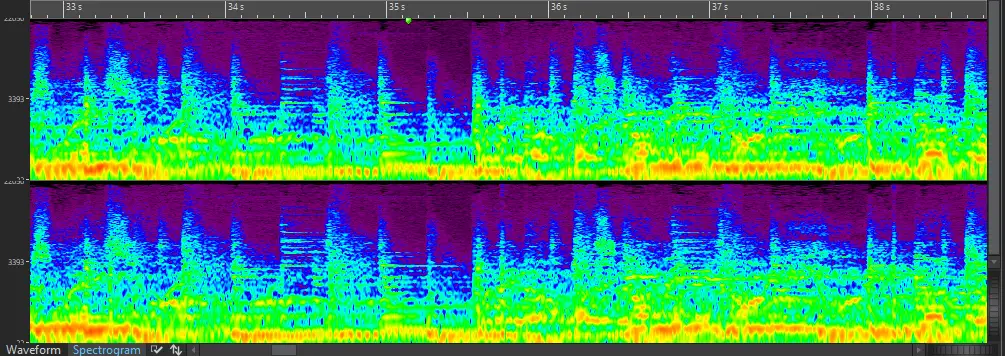
Audacity
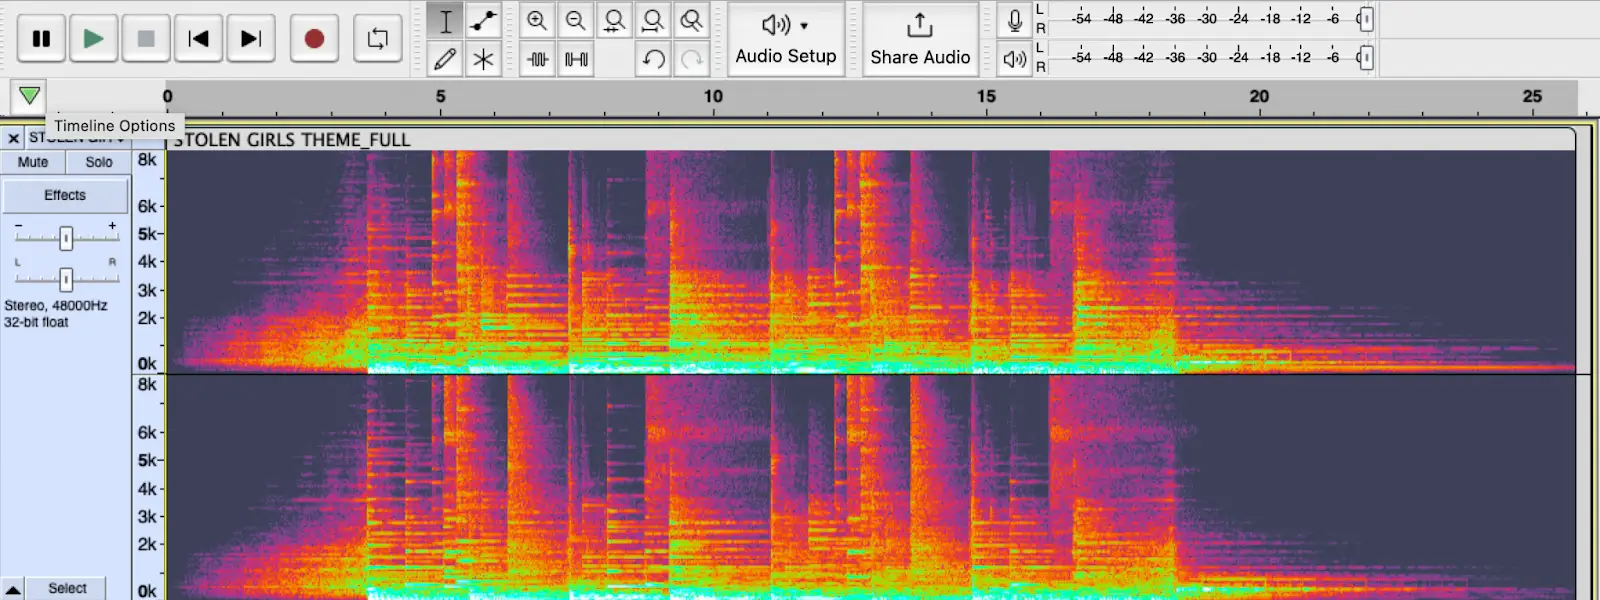
Audacity is an open-source audio workstation with many features. Best of all, it's completely free. And it includes a spectrogram view, and basic noise reduction tools.
It may not have all the bells and whistles of its bigger competitors, but it sure is light on the wallet. This makes it a great way for newcomers to explore spectral editing and how to implement it in your workflow.
Practical and Creative Uses For Spectrograms
In addition to being visually appealing representations of sound, spectrograms have an abundance of practical and creative uses in many areas.
Audio Clean Up and Restoration
Out of all the various ways spectrograms can be used, this is perhaps the most useful for musicians.
Let's say there's a dusty old vinyl recording you want to sample for your next anthem. (Make sure you get clearance first!).
Once you've captured the audio you can use a spectrogram to identify any clicks, pops, crackles and other unwanted vinyl noise and reduce or eliminate them. This leaves you with a nice, clean sample to mash up creatively. You final masterpiece will sound pristine.
Another way spectrograms can be useful in the studio is by removing unwanted noises in recordings. For example, if your guitarist's rig suffers from electrical noise, you can 'see' the offending frequency and clean it up.
Spectrograms are also often used to remove unwanted noises from vocalists or dialogue in post-production, such as mouth clicks or plosives.
Mix Analysis and Problem Solving
If you have a mix that's giving you trouble try looking at it as a spectrogram. Analyze the frequency content for problem areas you can tackle with judicious use of EQ .
You can also use a spectrogram view on a reference track and see how the whole spectrum compares to your mix.
Sound Design
A spectrogram can be used to create completely unique sound. By manipulating or applying effects to specific frequencies rather than the whole spectrum of the instrument/sound source, new and interesting textures can be created.
You can take this technique even further. Use spectral editing to 'draw' shapes into a spectrogram, and play the 'picture' back as frequency content. This can result in interesting, and sometimes unhinged sound.
Aphex Twin did exactly this on his 1999 'Windowlicker' EP. You can check this out, and more examples, on this fascinating website .
Other Uses For A Spectrogram
Spectrograms aren't just the playthings of musicians and post-production houses. They can be used to distinguish bird song, reduce noise pollution, and used to train speech processing algorithms. Spectrograms can even track the movement of tectonic plates. Cha-cha-slide indeed.
Conclusion
Spectrograms are becoming increasingly common as a tool in music production on both practical and creative levels. As well as fixing noisy speech or recordings, you can create never-before-heard sounds and textures.
There's a spectrogram computer program to suit every budget, so pick one, dive in, and get processing!
Now say the word axis over and over again until it sounds weird.